Advertisement
Chart Book | Chart of the day: Shenzhen A shares battle on
Reading Time:1 minute
Why you can trust SCMP

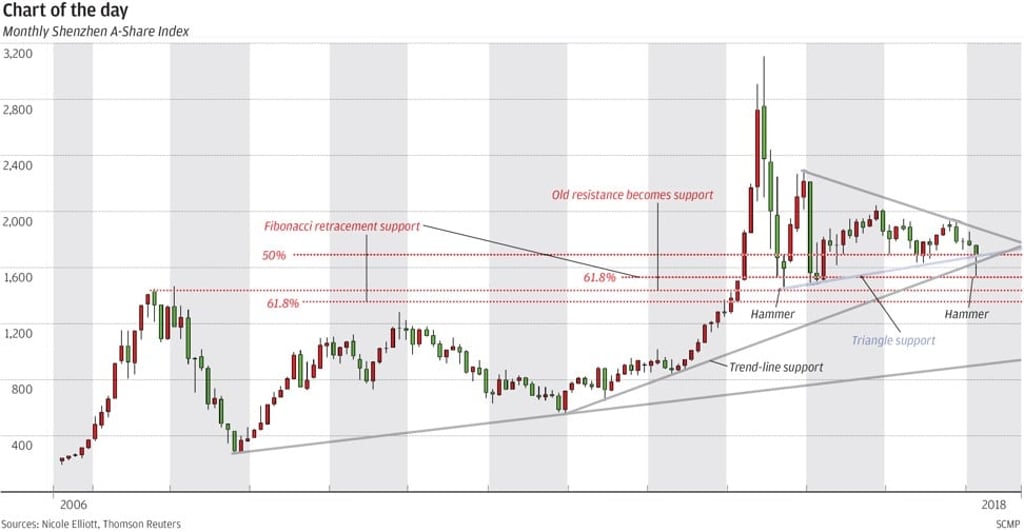
As we pointed out early in February, the slump in the Shenzhen A-Share Index since October is an A, B, C-type correction where the C leg dropped nearly 161 per cent of the height of the A wave. Fibonacci 61 per cent retracement from the late 2012 low caught the nadir exactly, the dip below trend-line support (again from the 2012 low) is an extension in a highly volatile market. We have now completed an impressive hammer candle on the monthly chart marking an intermediate low point, rather like the smaller one of September 2015. The fact it is now closed inside the triangle is very impressive indeed, suggesting another extension in an overexcited sell-off.
Nicole Elliott is a technical analyst
Advertisement
Advertisement
Select Voice
Select Speed
1.00x

